
The Ultimate Guide to Testing and Validating Your Strategies
Learn how to properly test strategies using MetaTrader, from choosing the right platform to conducting comprehensive backtests that actually matter.
Testing Strategies
MetaTrader 4 or MetaTrader 5 for Strategy Testing?
This is probably the most common question we get, and the answer might surprise you! Let's break down why MetaTrader 5 should be your go-to choice for serious strategy testing, and when MetaTrader 4 might still have a place (spoiler: it's very limited).
MetaTrader 4 - The Convenient but Flawed Option
Don't get us wrong - MetaTrader 4's strategy tester is simpler and more user-friendly than MetaTrader 5's version. It's like driving an automatic car versus a manual - easier to get started, but you're missing out on precision and control.
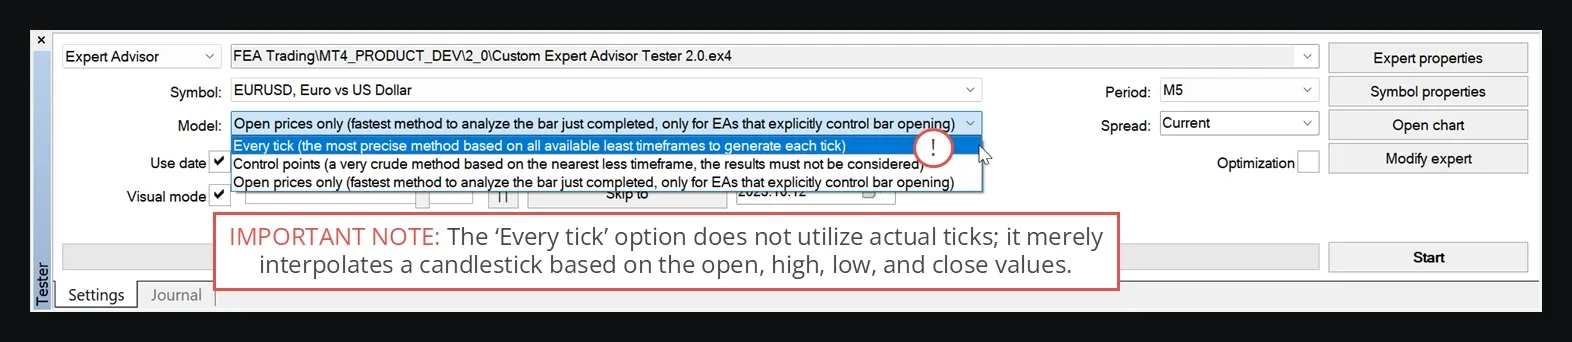
Here's the big problem: MetaTrader 4 doesn't use real tick data! Even when you select the "Every tick" option, it's basically making up the data as it goes. This was fine back in 2002 when MetaTrader 4 was designed (high-frequency analysis wasn't even a thing yet), but it's completely outdated now.
Back then, storing 20 years of tick data would have required 30GB of storage - which was impractical when 20GB hard drives were the norm! So MetaQuotes decided to emulate tick data instead. You can read more about this outdated approach in this detailed explanation.
Here's the scary part: countless algorithm sellers use MetaTrader 4's predictable fake data to create astronomical performance results that look amazing but are completely unrealistic. It's like playing a video game on easy mode and then expecting the same results in real life!
The Bottom Line: The only valid use for MetaTrader 4's strategy tester today is for initial brainstorming with visual mode enabled. That's it.
Warning: Never trust a performance chart made with MetaTrader 4!
MetaTrader 5 - The Real Deal
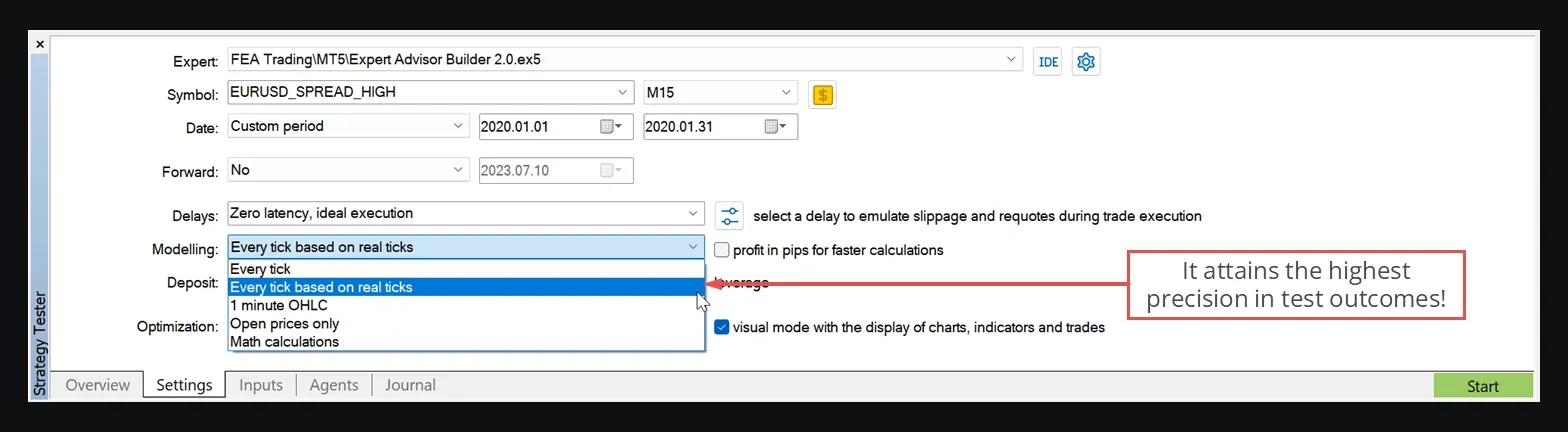
MetaTrader 5, released in 2008, was built for the modern market analysis world. Its strategy tester can use real tick data through the "Every tick based on real ticks" model. This is the only way to properly evaluate your strategy's performance and drawdown.
But here's the catch: where do you get quality tick data? MetaTrader 5 has built-in tick data, but it's usually limited to recent months and often comes from your provider (who might have "polished" it to look better).
The ideal solution? Use independently collected tick data spanning 20+ years with spread profiles that match your actual provider. That's where our MT5 Tick Data come in - giving you access to precise historical tick data going back up to 20 years!
Golden Rule: Only trust performance diagrams from MetaTrader 5 using "Every tick based on real ticks" with at least 200+ simulated trades.
Setting Up Your Reference Test Range
Understanding Trends and Timeframes
Let's talk about trends - they're like the currents in an ocean. You've got three types: short-term, intermediate-term, and long-term. Think of them as waves, swells, and tides.
Here's a fundamental rule that'll save you a lot of heartache: Never go against the trend!
This means you need to analyze multiple timeframes to make sure all your trades flow with the current, not against it. Start by picking your main timeframe - this is where you'll look for opportunities and generate signals.
But here's the smart part: always use a higher timeframe as a filter. If you're analyzing the 1-hour chart but the daily trend is going down, maybe skip that long trade you were considering!
Here's a handy reference table for timeframe combinations that work well together:
| Trend type / Analysis style | Short-term | Intraday | Swing | Long-term |
|---|---|---|---|---|
| Long-term trend | M30 | H4 | D1 | MN |
| Intermediate trend | M15 | H1 | H4 | W1 |
| Short-term trend (Analysis) | M1 | M15 | H1 | D1 |
So if you want to analyze the H1 timeframe, you'd check H4 for the intermediate trend and D1 for the long-term trend. Makes sense, right?
Creating Your Reference Test Range
Here's where things get interesting. Your reference test range should be like a complete market story - it needs to include an upward phase, a downward phase, and a sideways phase, with the overall change being roughly zero.
Think of it this way: if you had just bought and held during this period (without any fees), you'd break even. This gives you a perfect baseline to measure your strategy against.
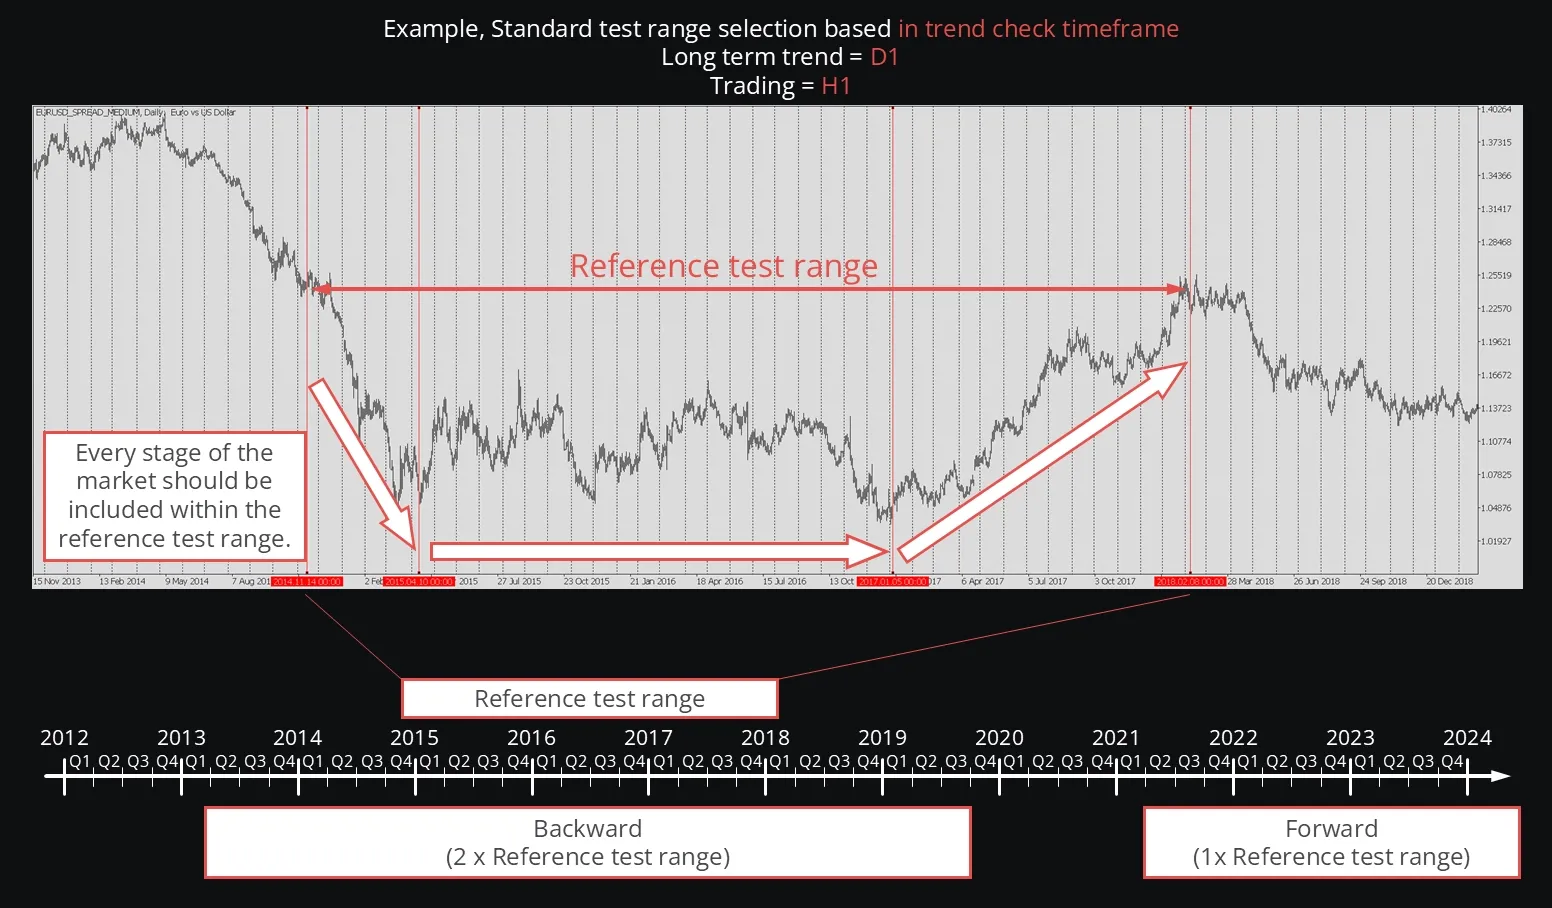
This might require several years of data, even if you're analyzing shorter timeframes. But trust us, this thoroughness is what separates successful analysts from gamblers.
Your testing periods should never overlap:
- Historical test range: At least twice your reference test range
- Forward test range: Same duration as your reference test range (but never used for optimization!)
The forward test is your final exam - you only get to use it once to validate your completed strategy.
The Four-Phase Testing Model
Developing a solid automated system isn't a sprint - it's more like building a house. You need a solid foundation and a step-by-step approach.
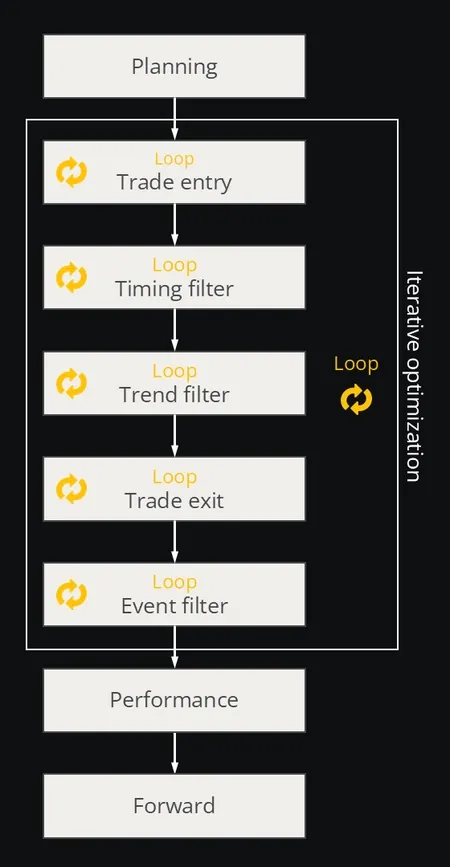
Here's our four-phase approach that actually works:
Phase 1: Planning - The Blueprint Stage
This is where you put on your architect hat and design your strategy idea. Don't skip this step - it's tempting to jump straight into coding, but proper planning saves you weeks of debugging later!
Here are some key questions to answer:
- What timeframes will you use for opening and closing trades?
- Which timeframe will you use to identify intermediate and long-term trends?
- What market volatility levels do you need in each timeframe?
- What's the current momentum in your analysis timeframe?
- Is the spread reasonable for your strategy?
- Are there upcoming news events that could mess with your plan?
- Where are the key support and resistance levels?
- How much risk are you comfortable with?
- Do you want to avoid holding positions overnight?
Pro tip: Create a document answering these questions before you write a single line of code. Once you've got clarity, you can use MetaTrader 4's visual mode for a quick functional test. This is literally the only good use case for MetaTrader 4's strategy tester - and since accuracy doesn't matter here, it's actually convenient!
Phase 2: Iterative Optimization - Fine-Tuning
This is where the magic happens, but also where most people go wrong. The key is testing one thing at a time!
Let's say you want to understand how trailing stop losses affect your strategy. Keep everything else constant and just test different trailing methods. This way, you can actually see what each change does to your performance.
Important: Once you optimize a parameter, don't touch it again! This prevents you from falling into the over-optimization trap.
For this phase, use MetaTrader 5 with either "OHLC" or "Every tick based on real ticks" as your data model, and test on at least twice your reference test range.
Phase 3: Performance Evaluation - The Moment of Truth
Time to see how your strategy really performs! Use "Every tick based on real ticks" and all available tick data (except what you're saving for the forward test).
Here's a cool trick: since your reference test range has roughly zero price change, you can easily categorize your strategy's performance:
Overperforming Strategy
Most of your performance checkpoints (75%+) are above the baseline. This is what you're aiming for!
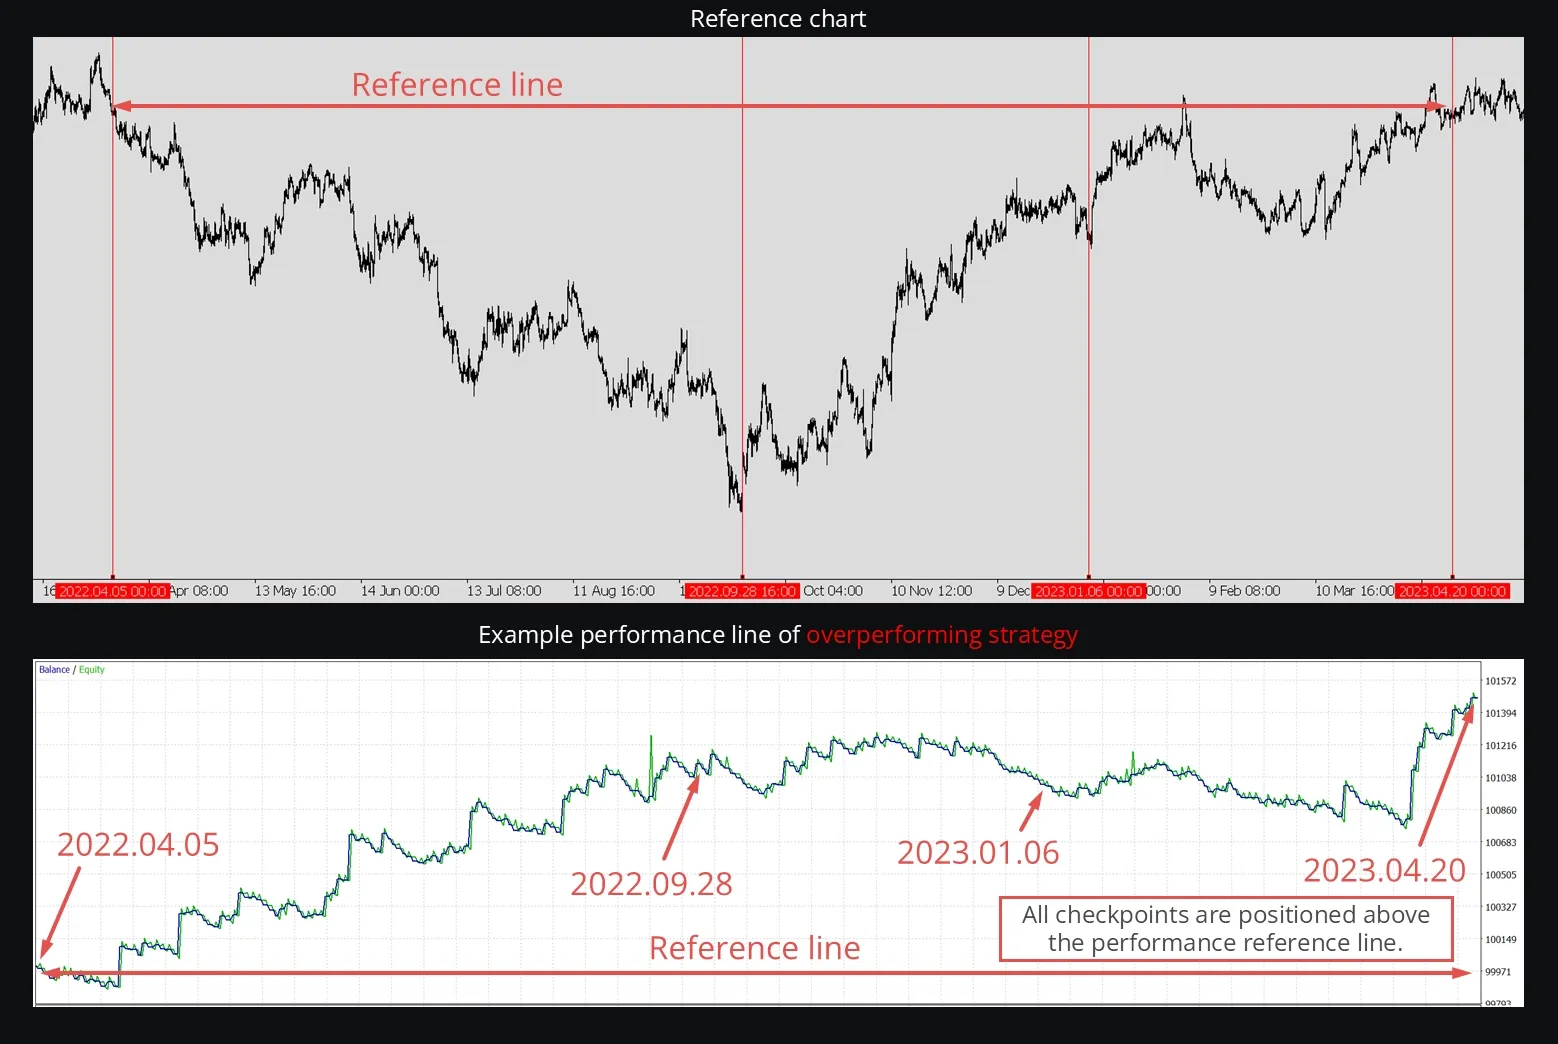
Your strategy significantly outperforms the market - congratulations, you might have found a winner!
Neutral Performing Strategy
Your checkpoints are scattered above and below the baseline. This might be profitable long-term, but it could also slowly bleed money.
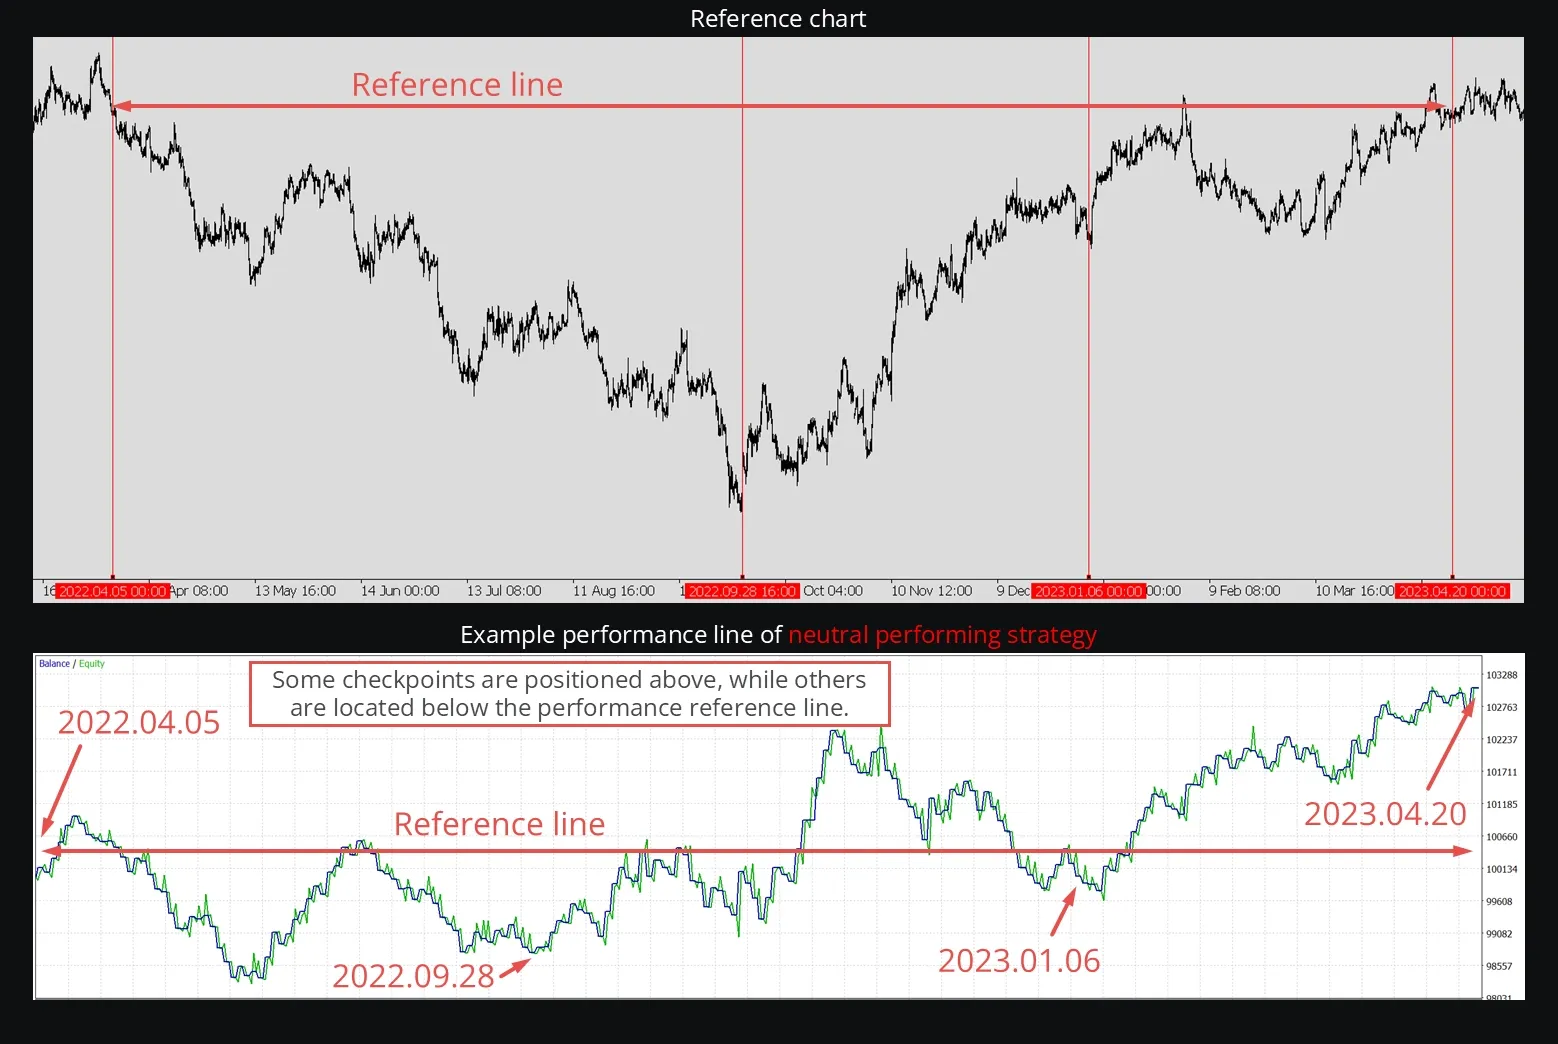
Don't throw it away yet - often these can be tweaked into profitable systems. Time to go back to phase 2!
Underperforming Strategy
Most checkpoints are below the baseline. This strategy systematically loses money.
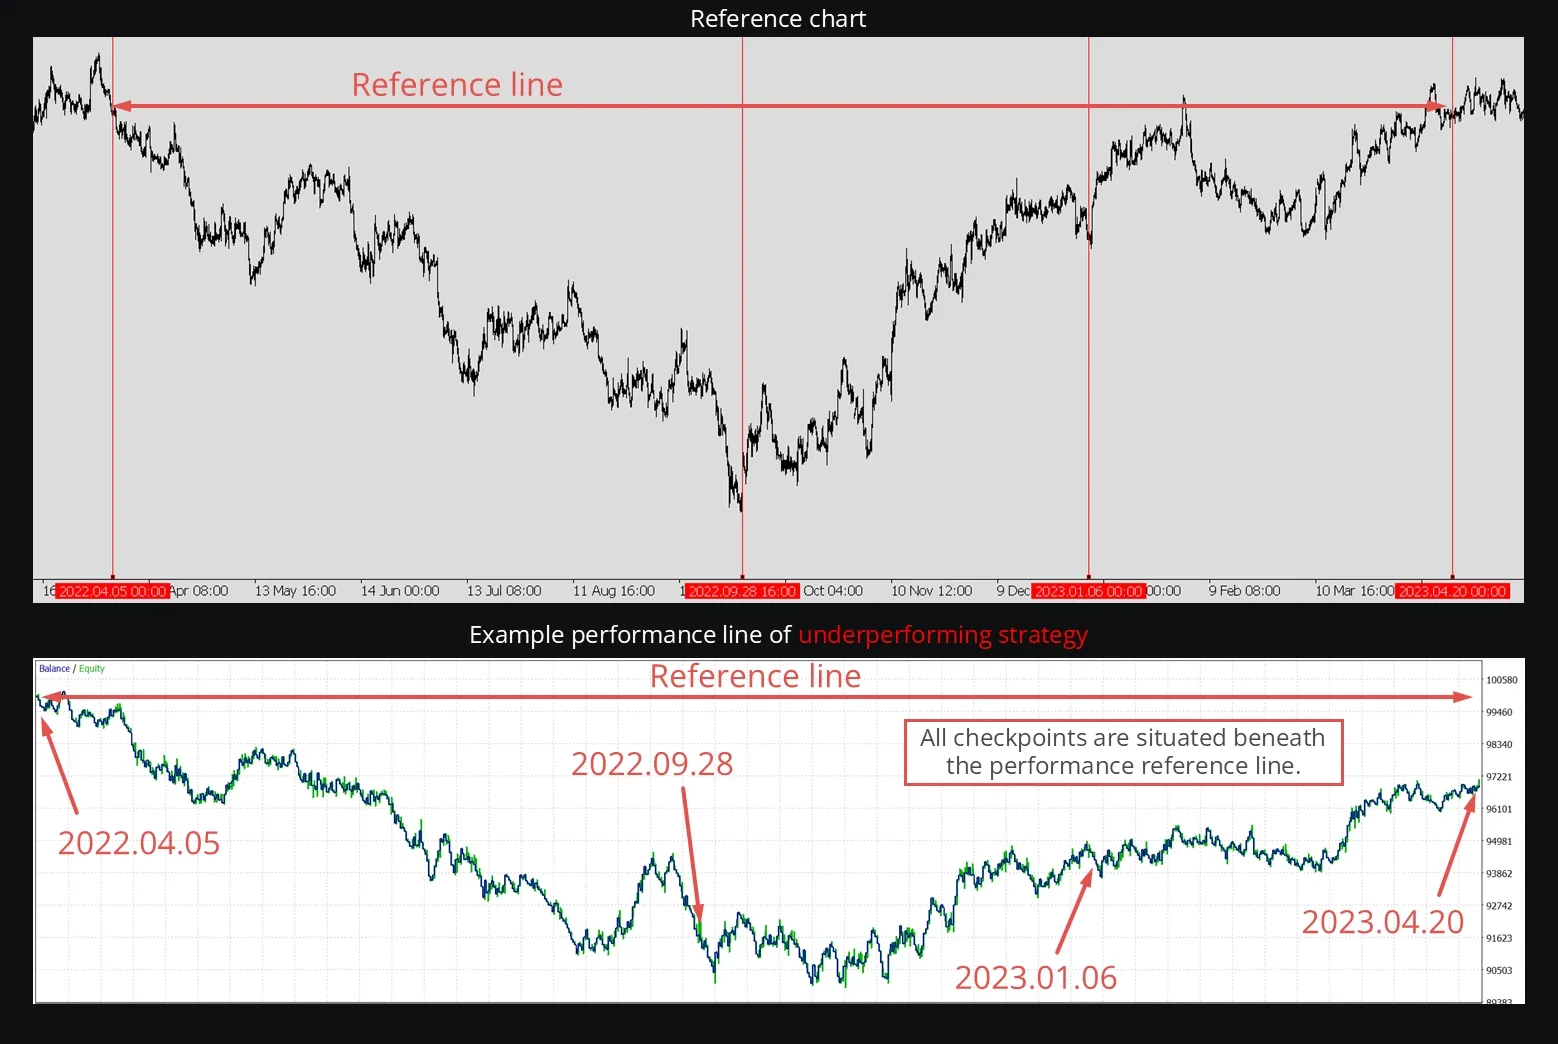
This one's a no-go for live use. Back to the drawing board!
Phase 4: Forward Testing - The Final Exam
This is your strategy's final test before going live. Use tick data that hasn't been touched by any previous testing - think of it as completely fresh market conditions.
If your strategy outperforms the most recent market performance in this forward test, you've likely got a winner! This is your best simulation of how the strategy might perform in live conditions.
Wrapping Up
Strategy testing isn't just about running a historical test and hoping for the best. It's a systematic process that requires:
- The right tools (MetaTrader 5 with real tick data)
- Proper methodology (the four-phase approach)
- Patience (no skipping steps or over-optimizing)
- Realistic expectations (not every idea will work)
Remember: a strategy that looks good in historical testing but fails in forward testing isn't worth risking real money on. The forward test is your reality check - if it doesn't pass, neither should your money!
The goal isn't to create the perfect strategy (they don't exist), but to develop a robust system that can perform consistently across different market conditions. Take your time, follow the process, and most importantly - never trust results from MetaTrader 4's strategy tester!
Happy testing, and may your forward tests be ever in your favor!